Hioki's data logger LR8450 & Hukx's heat flux sensors FHF05
Battery EV thermal management
Development of battery electric vehicles (BEVs) has been accelerating in recent years. Lithium-ion batteries are susceptible to thermal changes, and at cold temperatures in particular their performance declines temporarily, along with available capacity. BEVs lack a heat source in the form of an engine. Consequently, it's necessary to collect heat generated by nearby components like motors and inverters in order to extend their driving range. Heat flow can be measured by combining the LR8450 with the FHF05 heat flux sensor. Since these sensors allow both temperature and the direction of heat movement to be confirmed, they are useful when validating thermal management.
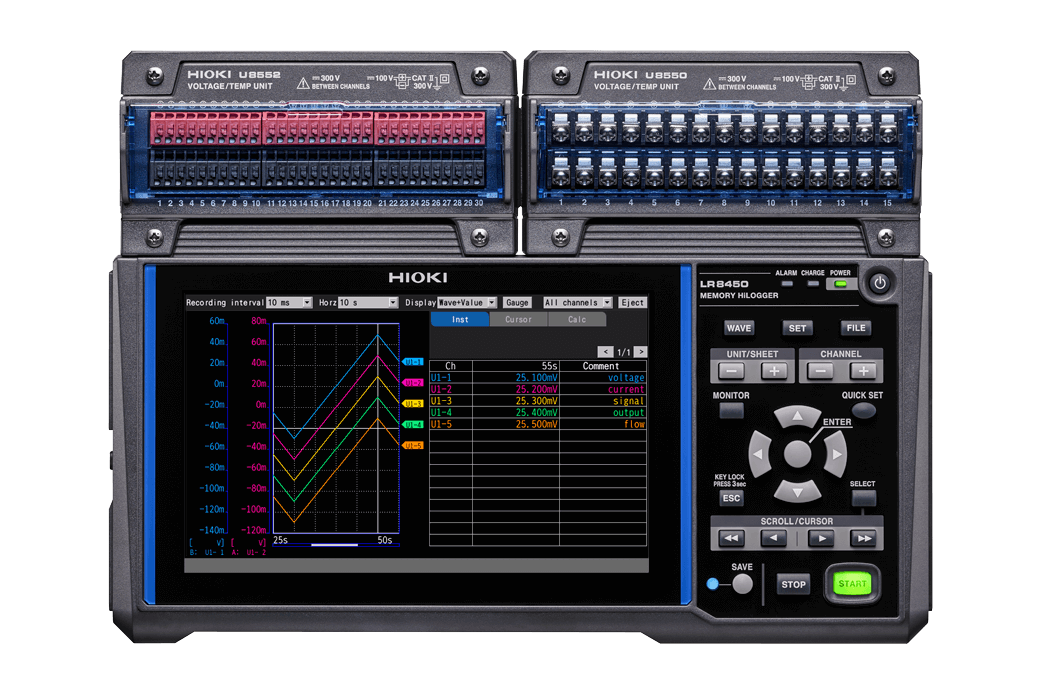
Visualizing heat movements with heat flow measurement
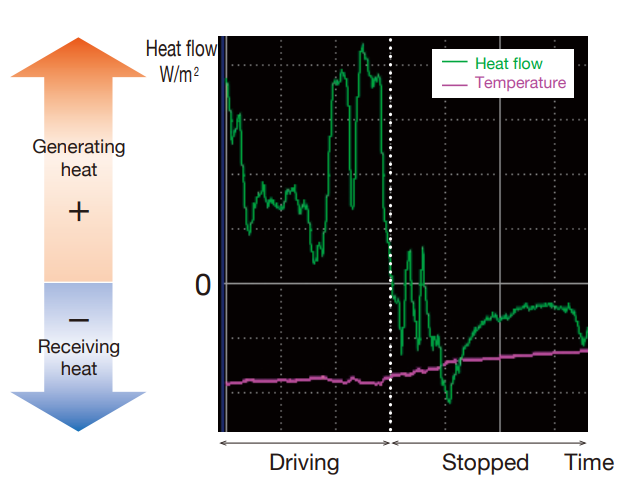
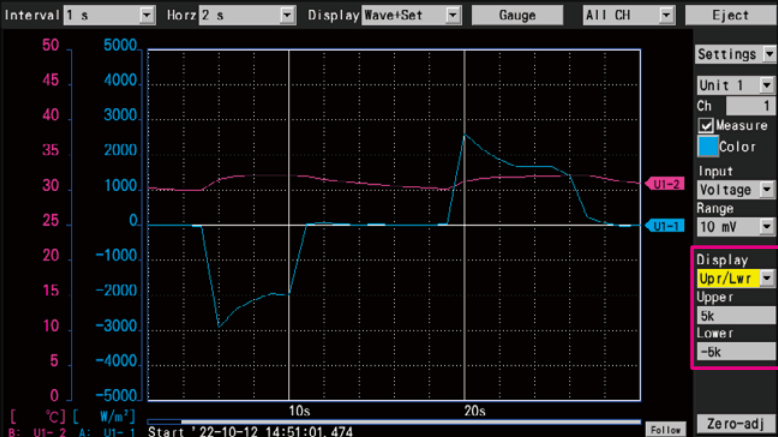
Movements of heat can be visualized by measuring heat flow. Since it's possible to check whether a given measurement target is generating heat itself or receiving heat from nearby components, this approach makes it possible to adopt effective heat countermeasures. Moreover, the ability to identify which components are generating heat facilitates optimal insulation and heat dissipation designs. Figure 2 shows a screen capture of the LR8450 and FHF05 to measure temperature and heat flow for a component in a vehicle while it was being driven. Whereas temperature continues to increase gradually, the heat flow graph changes from positive to negative when the vehicle is stopped. In other words, it was possible to confirm that the component generated heat while the vehicle was driving and then received heat from surrounding components when the vehicle was stopped.

Applications of heat flow measurement
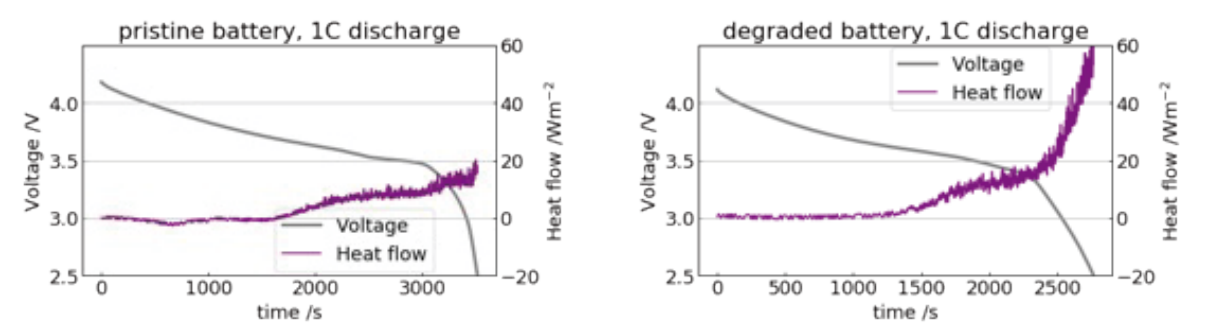
Battery performance and the speed of battery degradation are correlated with heat generation. The ability to measure heat flow in batteries is expected to facilitate performance evaluation and non-destructive degradation diagnostics.
Measurement method
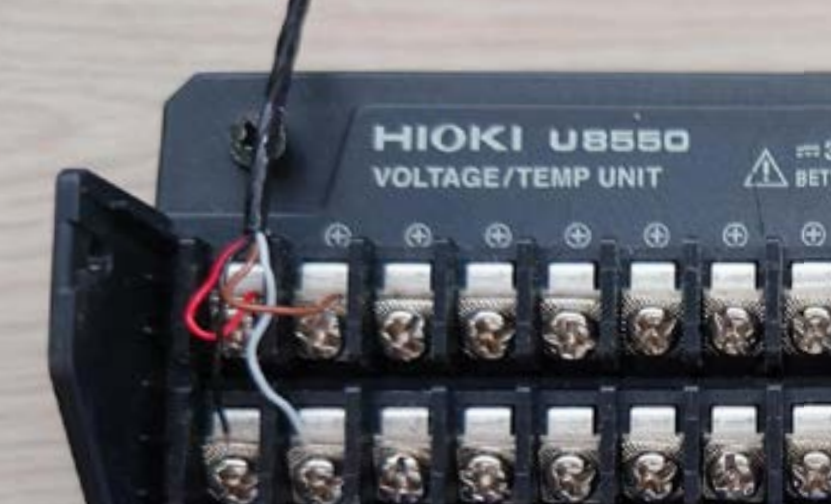
Connect the heat flow and temperature wires of the FHF05 to the measurement channels of the measurement unit for LR8450. The FHF05 can simultaneously measure heat flow and temperature with a single device.
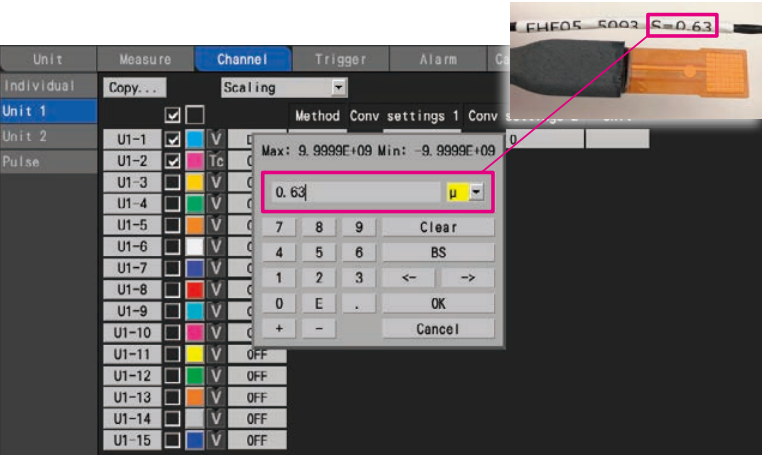
To read the heat flow rate directly, simply input the sensitivity coefficient (S) noted on the FHF05's cable into the LR8450's scaling sensitivity field. There's no need for time-consuming scaling calculations.
You can set upper and lower limit values on the waveform screen as desired and observe the waveforms. The ability to display two axes at the same time is extremely convenient when you wish to observe temperature and heat flow simultaneously.
Advantages of heat flow measurement with the LR8450
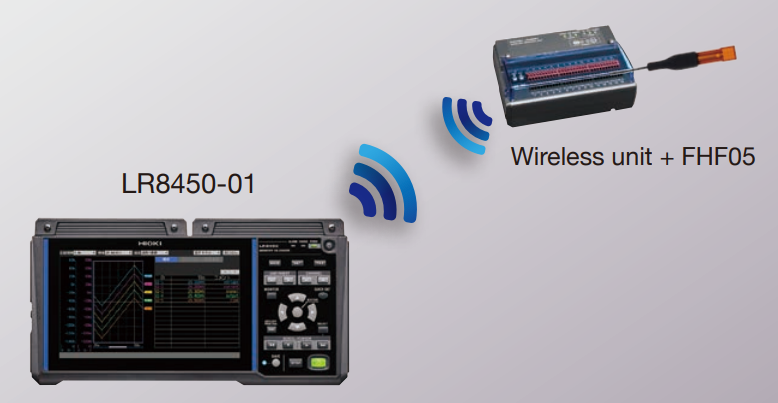
The wireless unit connected to a heat flow sensor can be placed near the measurement target, and you can observe variations in real time from a separate location.
Communications range: 30 m, line of sight
(The communications range may be shortened if you place the LR8450-01 or wireless unit on the floor or ground.)
The sensitivity of heat flow sensors is temperature dependent. The FHF05 can measure temperature as well as heat flow. High-precision heat flow measurement is possible by using temperature measured values to perform temperature correction with the LR8450's waveform calculation function.
Reference: the FHF05 is calibrated at 20 °C if the sensitivity at that time is represented by S20, the sensitivity S at temperature T can be calculated as follows: S = S20 {1 + 0.002 x (T - 20)} As an example, measurements of heat flow made when the temperature of the target is 120 °C will be affected by an error of 20 %.

Related products


We like having a good technical conversation
Do you have questions, need help finding the right solution, or looking to discuss an instrument for a unique application? Our technical engineers provide expert advise. Contact us now!